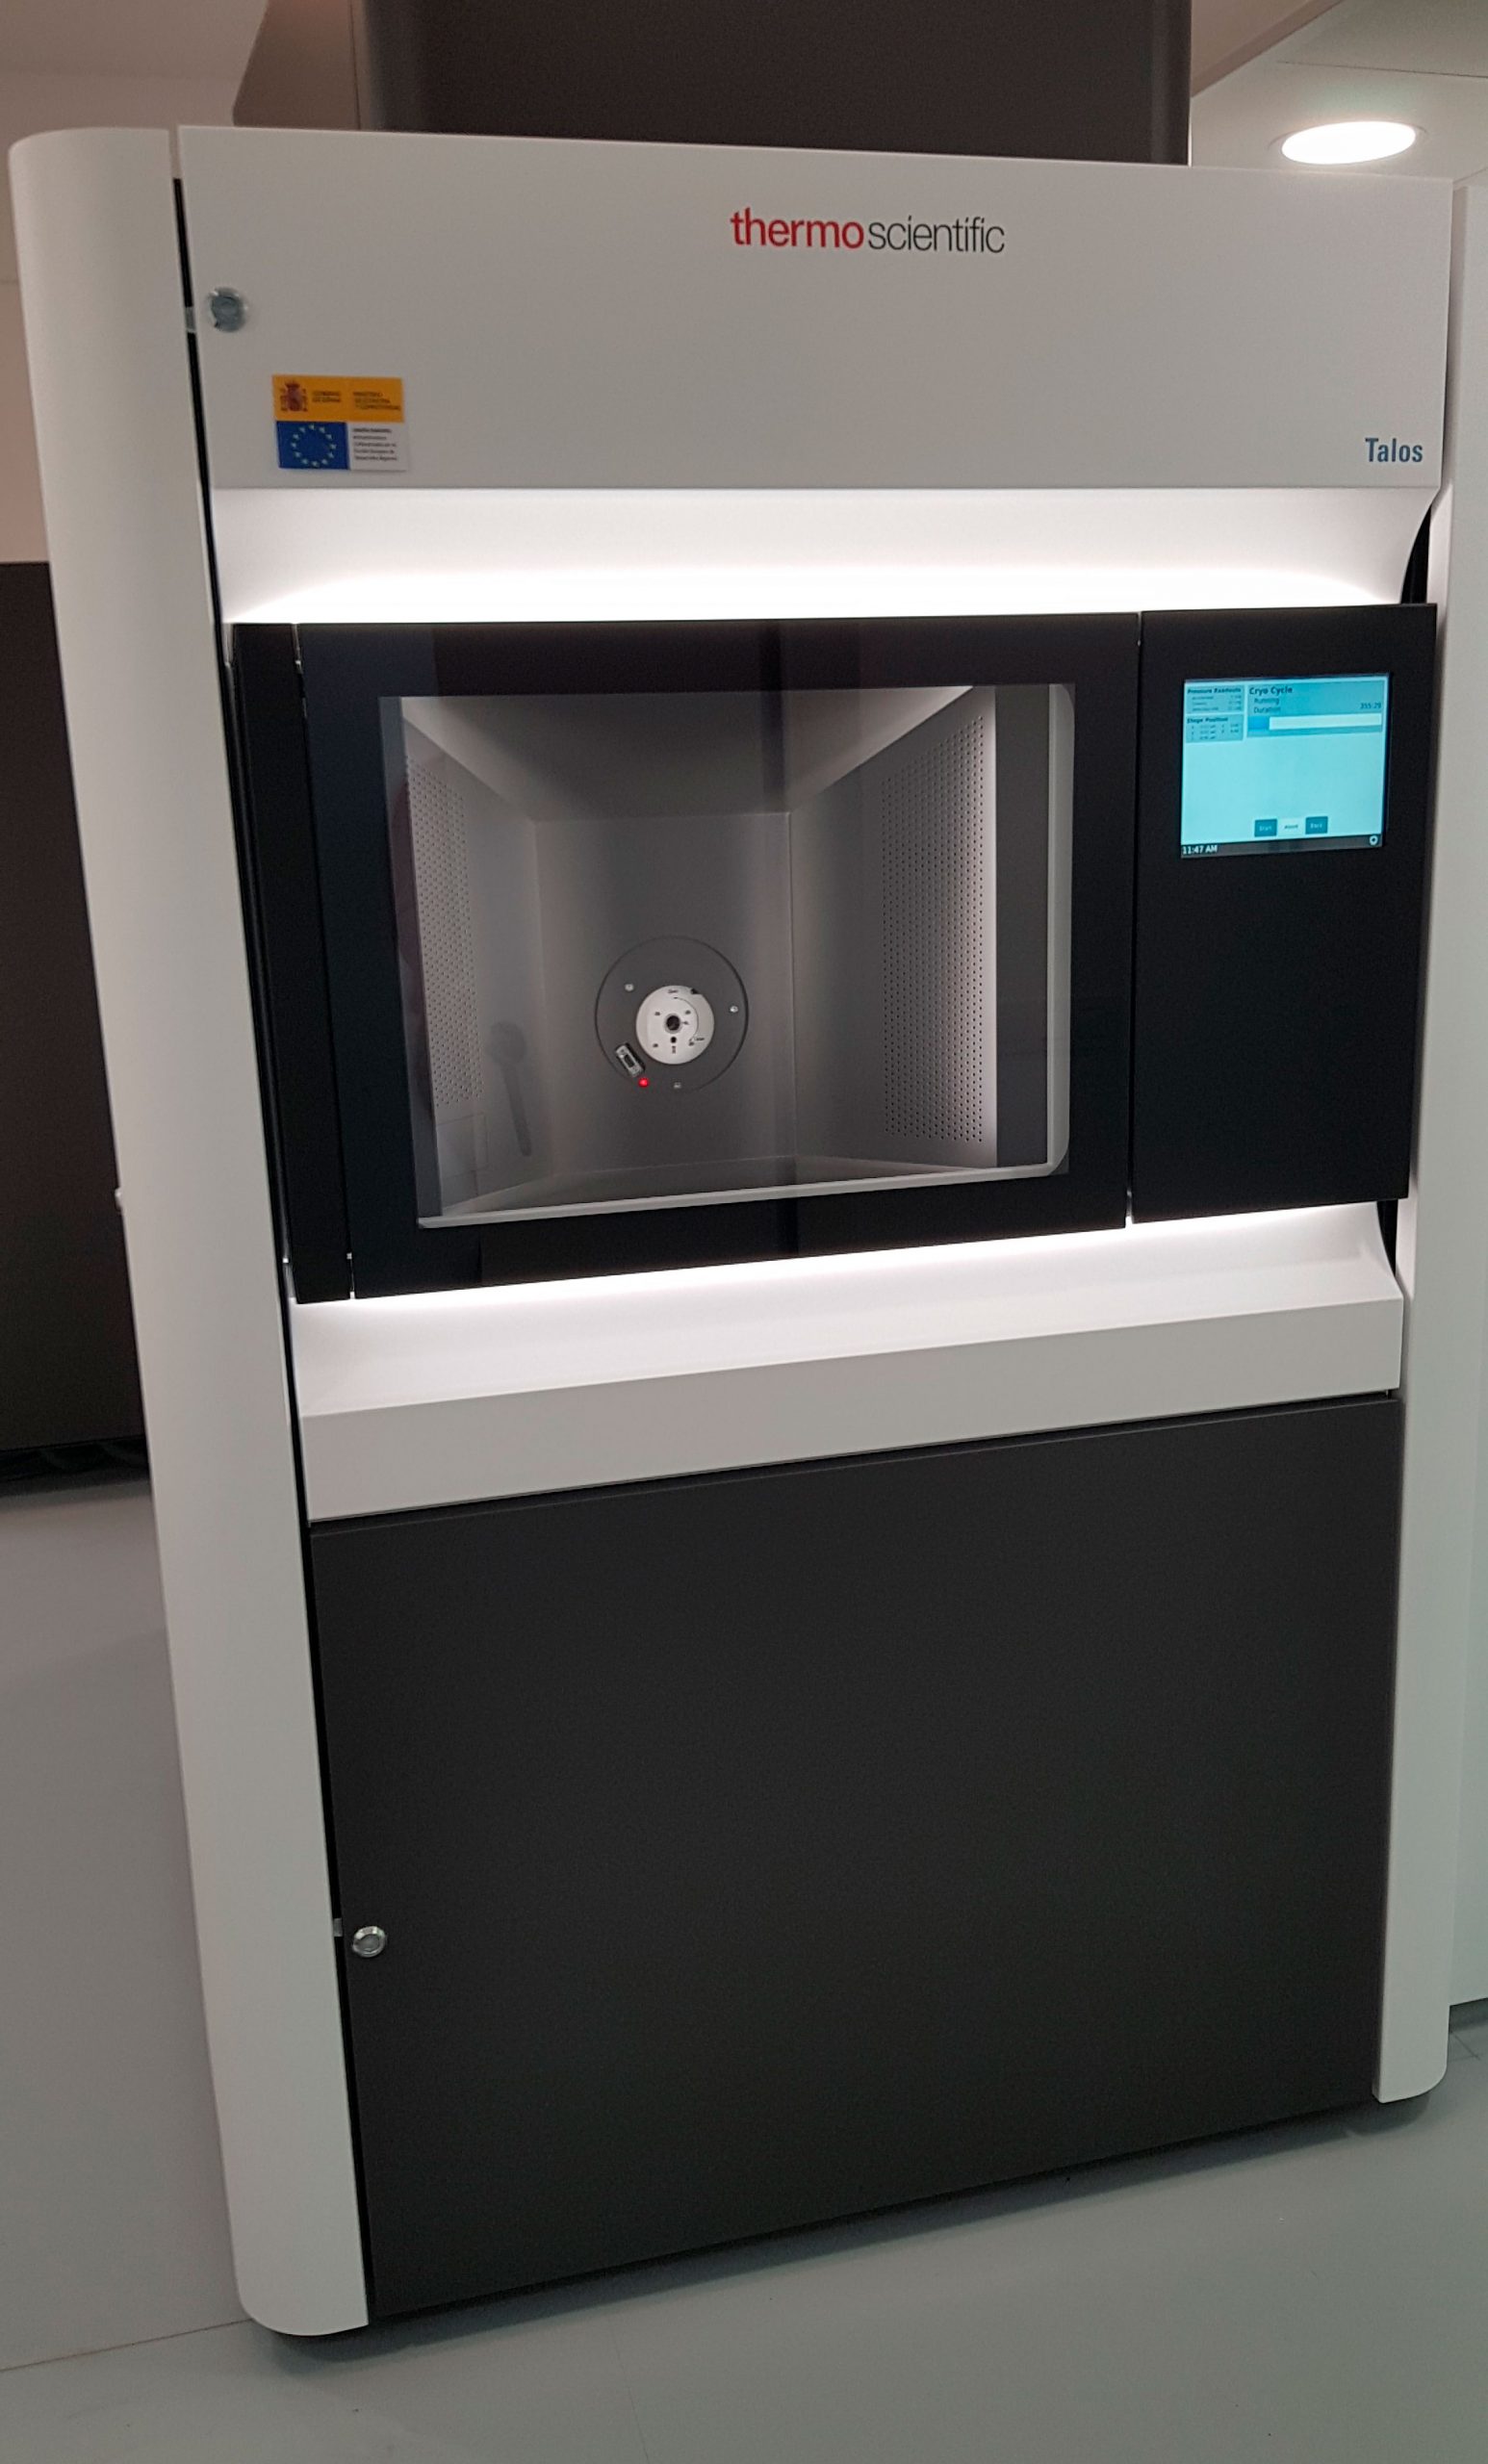
Talos F200X G2 TEM/STEM electron microscope allows characterizing the structure and composition of samples at atomic level. It allows recording information both in 2D and 3D.
Image acquisition:
- Resolution in HR TEM ≈ 0.25 nm (point resolution) @200 kV
- Resolution in HR STEM: 0.16 nm @200 kV. Simultaneous detection of 4 different STEM detector: HAADF, MAADF (DF4), ADF (DF2) y BF
- Electron diffraction
Spectroscopic techniques:
- Super-X EDS system equipped with 4 windowless SDD detectors providing a collection solid angle of ≈ 0.8 srad (energy resolution better than 136eV@Mn-Kα a 10,000 cps)
- Gatan Continuum Electron Energy Loss Spectrometer for qualitative, quantitative as well as electronic state analysis at subnanometric spatial resolution.
Electron Tomography studies:
- Two Electron Tomography holders available for the 3D characterization of nanostructures. Software for automated acquisition of TEM/STEM tomography experiments both in individual and batch type experiments. Holders and software for Analytical XEDS and EELS Electron Tomography experiments.
Investigation of air sensitive samples:
- Special holder available for anaerobic transfer of samples into the microscope to study air sensitive samples.
- Operating voltage: 80 and 200 kV
- High Brightness X-FEG Gun ≥ 7 x 10⁷ A /m2 sr V
- Resolution in STEM mode ≈ 0.15 nm
- Resolution in TEM mode ≈ 0.25 nm (point resolution)
- Super X G2 XEDS system (collection solid angle ≈ 0.8 srad)
- High resolution, high sensitivity Ceta CMOS camera (16Mpixels)
- Gatan Continuum Electron Energy Loss Spectrometer.
- Tilting range: ± 40° using standard holder; ±75° using tomography holders
- Velox software for acquisition of TEM y STEM data, XEDS studies and imaging in DPC and iDPC modes
- Software for automated TEM/STEM tomography. Simultaneous recording of up to 4 different STEM signals (BF, DF2, DF4, HAADF, XEDS). Analytical XEDS tomography.
- Crystal Pack software for compucentric 2-axis tilt and rotation, automated movement between different zone axis.
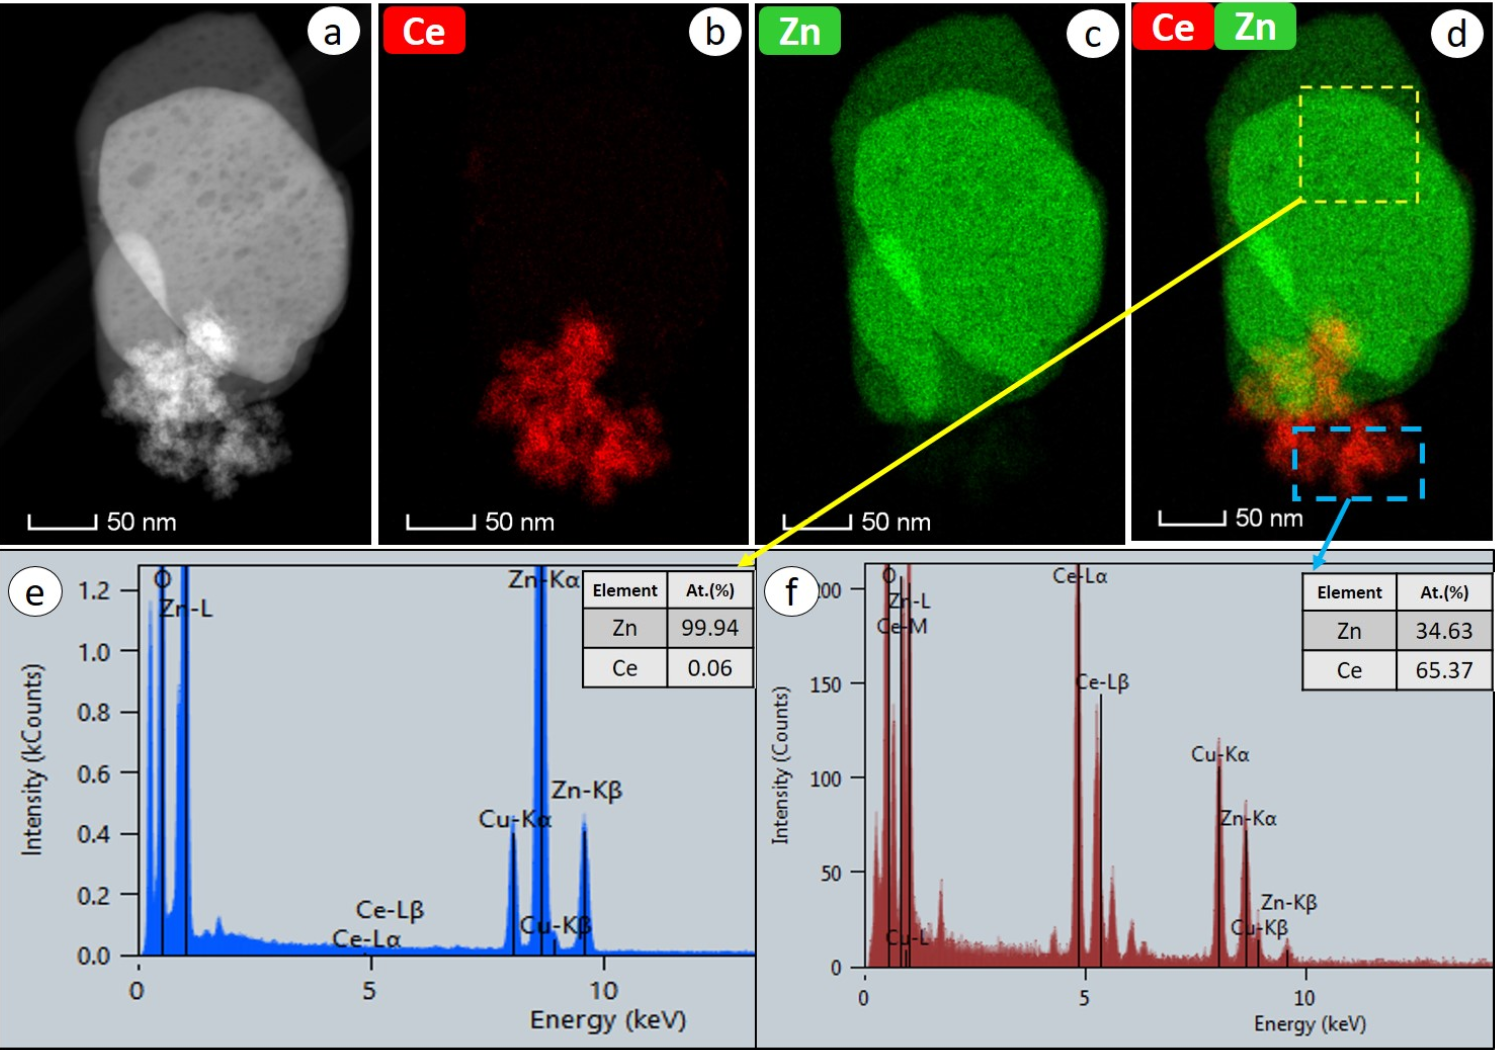
Nanoanalytical STEM-XEDS characterization of a 1% at. CeO2:ZnO photocatalyst. (a) HAADF-STEM image of the material; (b-d) spatial distribution of the different elements as observed by XEDS; (e,f) XEDS spectra showing the presence of pure ZnO and nanocrystals of a Ce0.65Zn0.35O2-x mixed oxide phase.
https://doi.org/10.3390/catal10050551
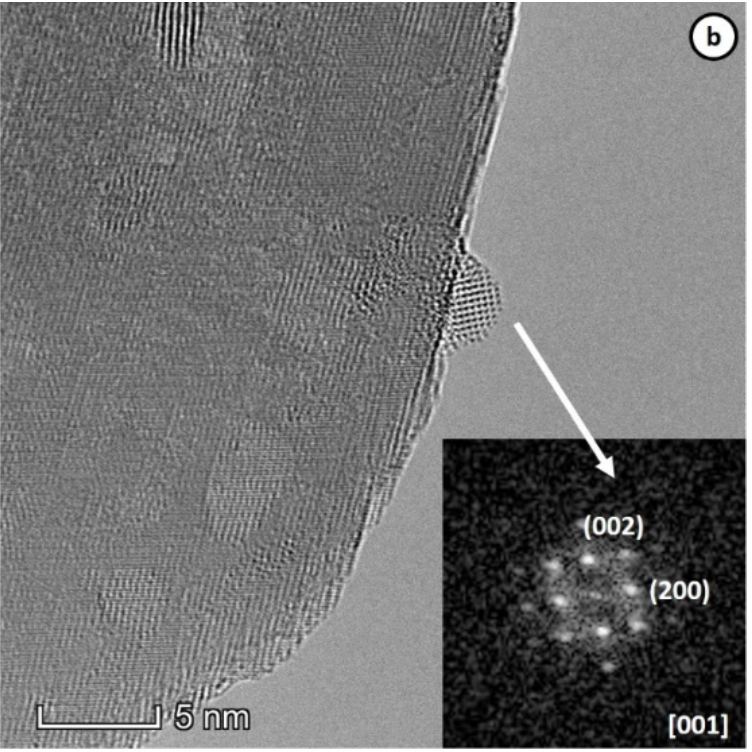
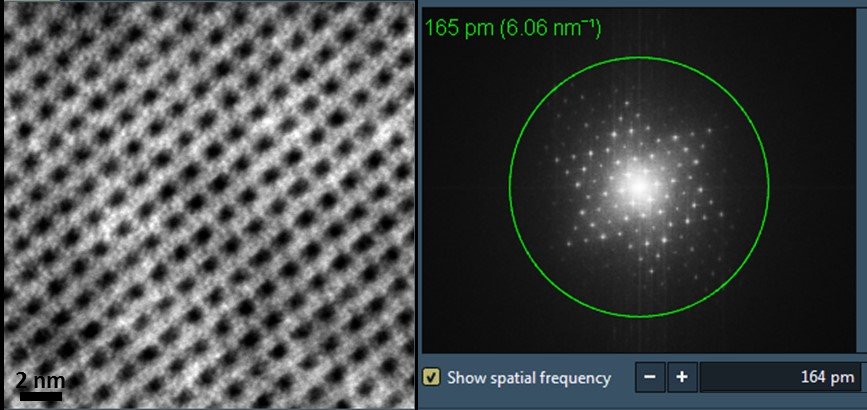
Structural analysis by HR-TEM of crystalline phases in a 1% wt. CeO2:ZnO photocatalyst. Analysis in the frequency space (Digital Diffraction Pattern) of the nanoparticle on the surface of a wurtzite type ZnO crystallite evidence the presence of a Ce0.65Zn0.35O2-x mixed oxide phase with fluorite-type structure.
https://doi.org/10.3390/catal10050551
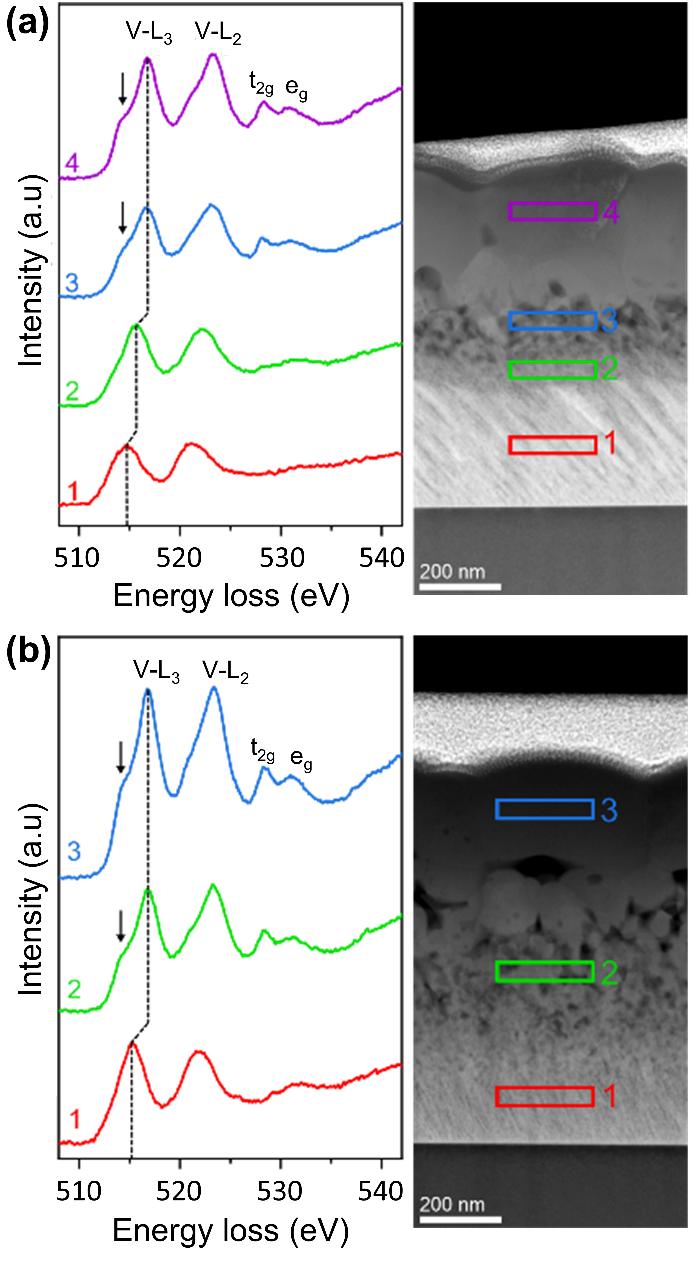
Analysis of the oxidation states in vanadium-based coatings: VO2 thermochromic phase has been controlled by fast thermal treatments of a magnetron-sputtered porous film of vanadium prepared at glancing angle deposition (GLAD). The EELS signals collected from the bottom part of the films (where the GLAD nanocolumns are still visible) match well with a metallic V or poorly oxidized vanadium (VO), whereas fingerprints of the V4+ valence state (VO2) are clearly evidenced in the top region.
https://doi.org/10.1016/j.surfin.2021.101581
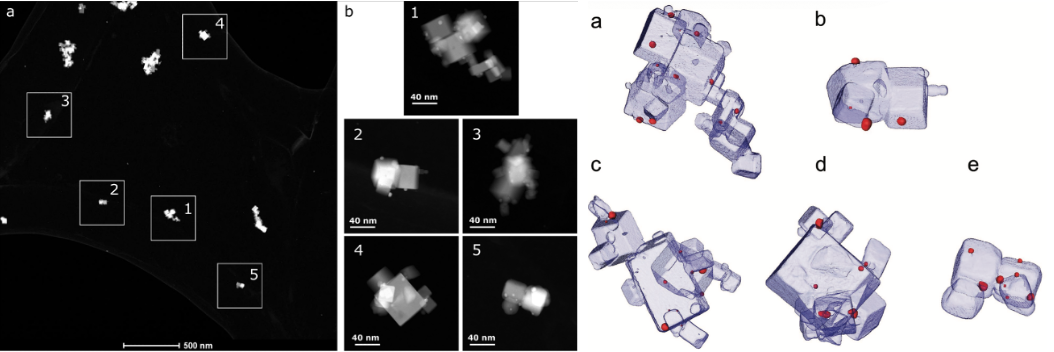
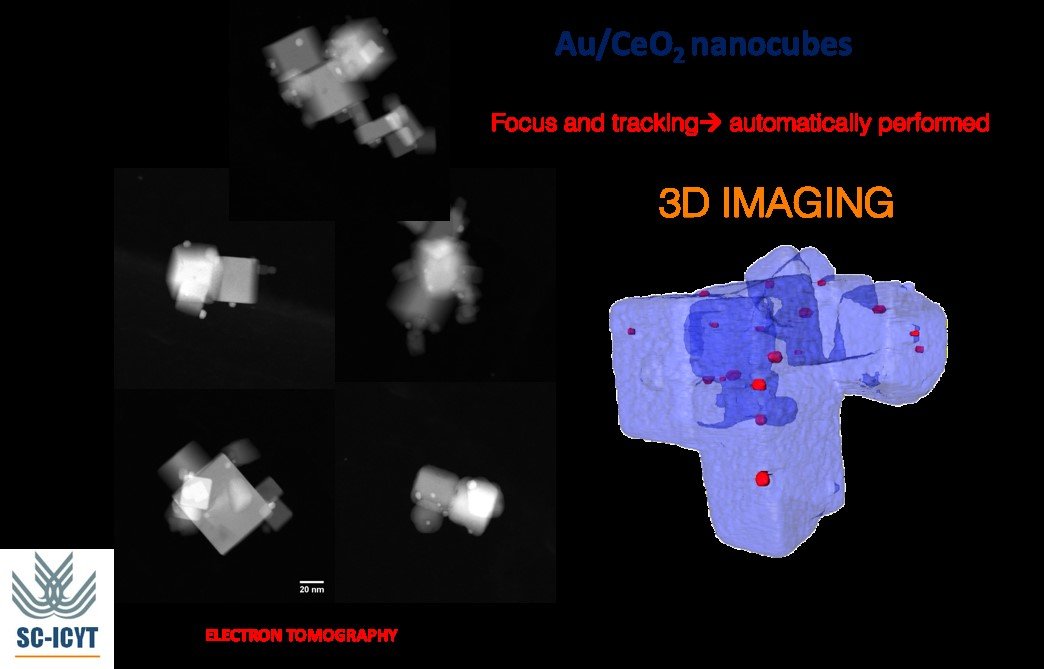
HAADF-STEM Batch electron tomography. Morphological characterization of a Au/CeO2 catalyst. (left) low magnification HAADF-STEM images showing different particles of the catalys; (middle) STEM-HAADF images of the collection of particles (batch) where complete tilt series (-70° – + 70°) were automatically recorded; (right) 3D rendering of the volumes after reconstruction. Au nanoparticles are shown in red and CeO2 in light blue.
https://doi.org/10.1002/ppsc.201700343
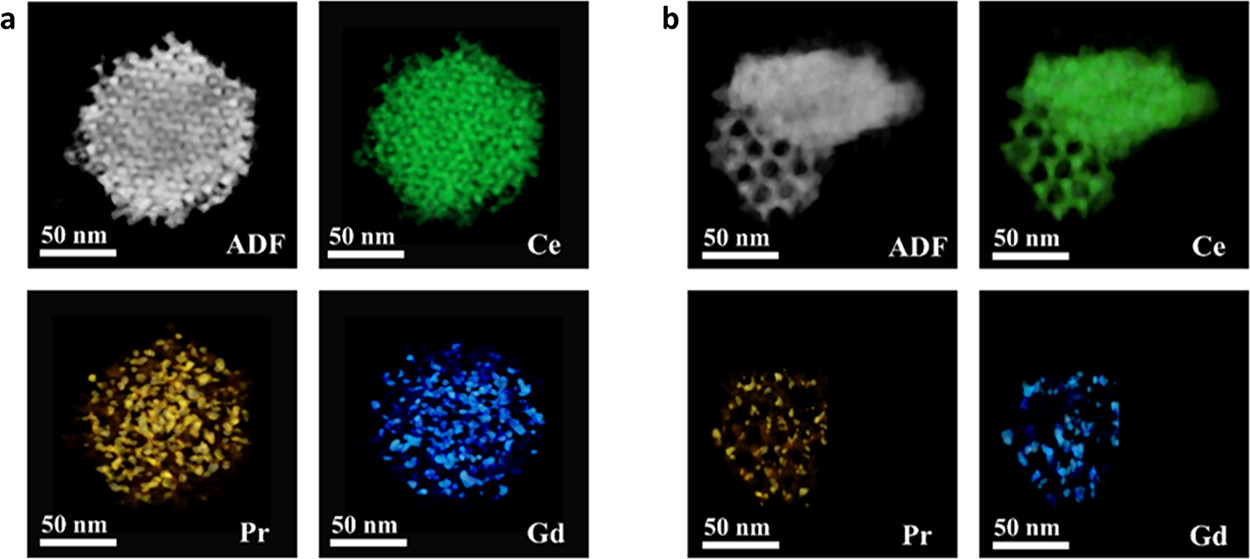
Analytical (XEDS) Electron Tomography. Lanthanide interactions in mesoporous Ce0.8Gd0.1Pr0.1O2 nanoparticles. (a) Volumes reconstructed from ADF and elemental maps from the X-EDS signals for the (a) packed double-gyroid structure and (b) partially filled single-gyroid structure. In the elemental maps, the higher the elemental concentration the higher saturation of color.