

APPLICATIONS TITAN3 THEMIS 60-300
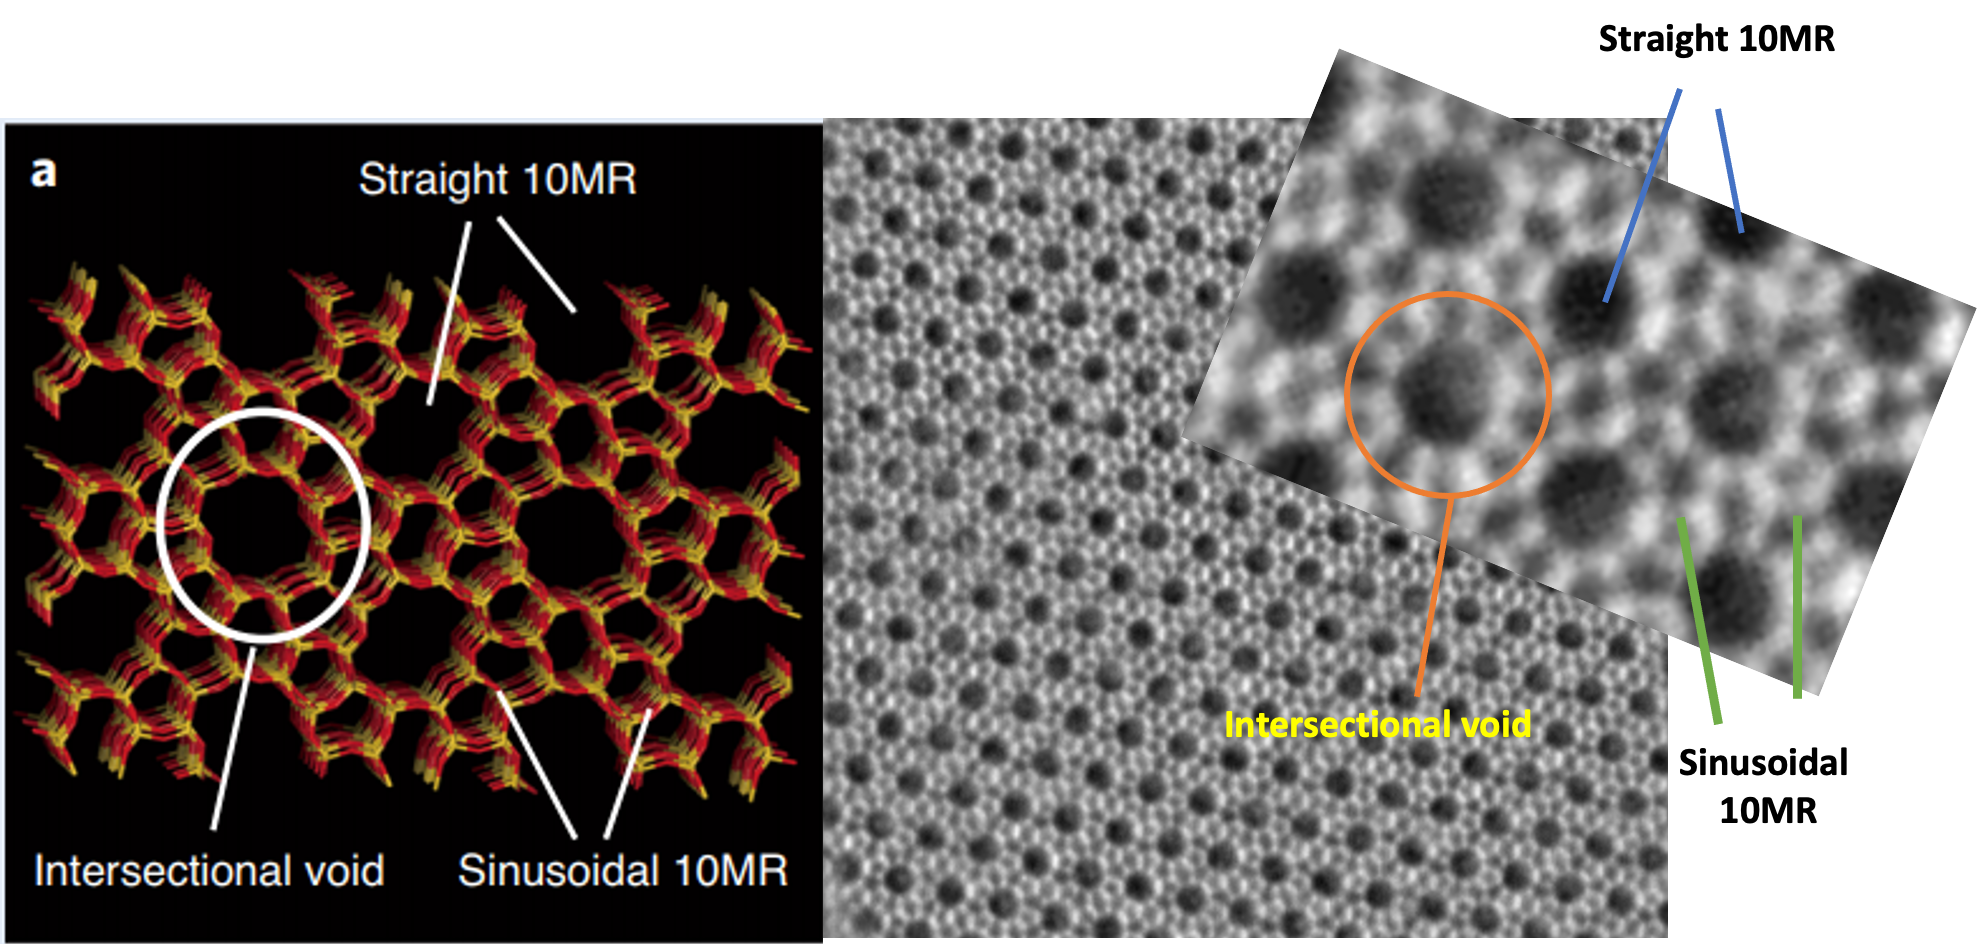
Atomic imaging of beam sensitive nanomaterials: Model (left) and STEM-iDPC image (right) of a crystallite of MFI zeolite along the [010] direction. As shown in the enlargement, the complete pore structure of this extremely beam sensitive material could be revealed using this very low electron dose technique.
https://doi.org/10.1038/s41929-020-0472-7
https://doi.org/10.1038/s41563-019-0412-6
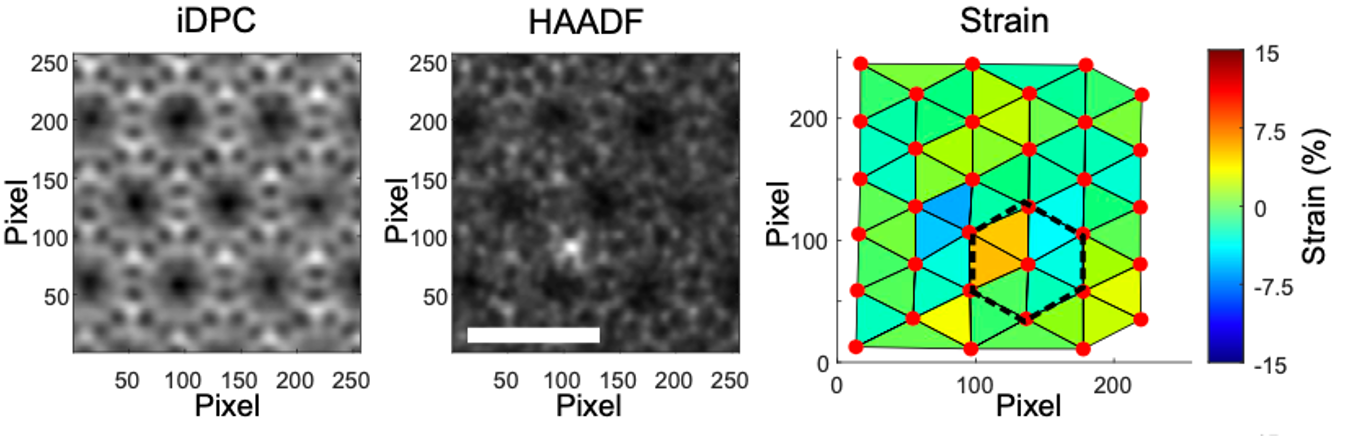
Determination of confinement effects in Metal/zeolite catalysts: STEM-iDPC (left) and STEM-HAADF (middle) image pair recorded on a Ir/MFI catalyst. Local strain analysis map obtained from the experimental image pair.
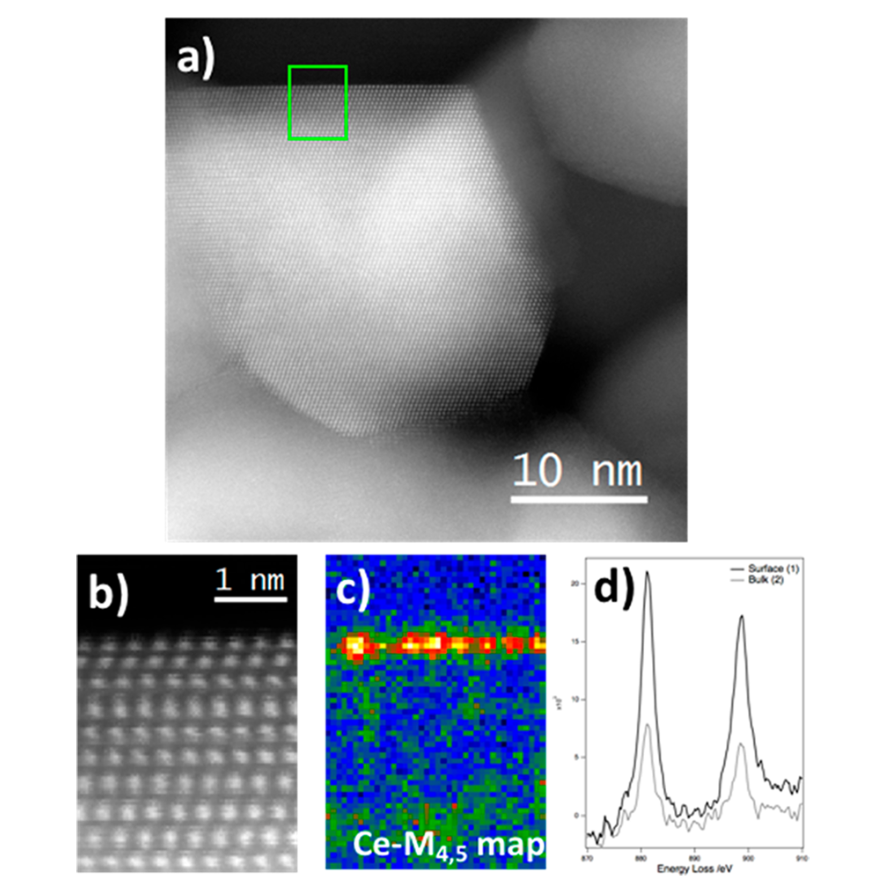
Detection and analysis of atomically-thin layers.– (a) STEM HAADF image of a CeO2/YSZ crystallite; (b)STEM-ADF image of an area at the surface of the crystallite; (c) Ce-M4,5 map showing a 1-atom thick CeOx-layer at the surface; (d) Analysis of the oxidation state of Ce in the layer.
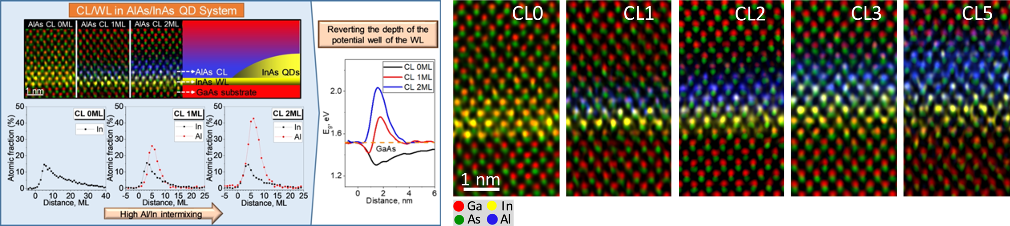
Chemical analysis (XEDS) with atomic column resolution. (left) Wetting (WL) and Capping (CL) layers on InAs quantum dots (QDs) grown onto a GaAs substrate. (right) atomic resolution XEDS elemental maps, for an increasing number of AlAs CLs, recorded on areas far from the QDs along the [110] zone axis.
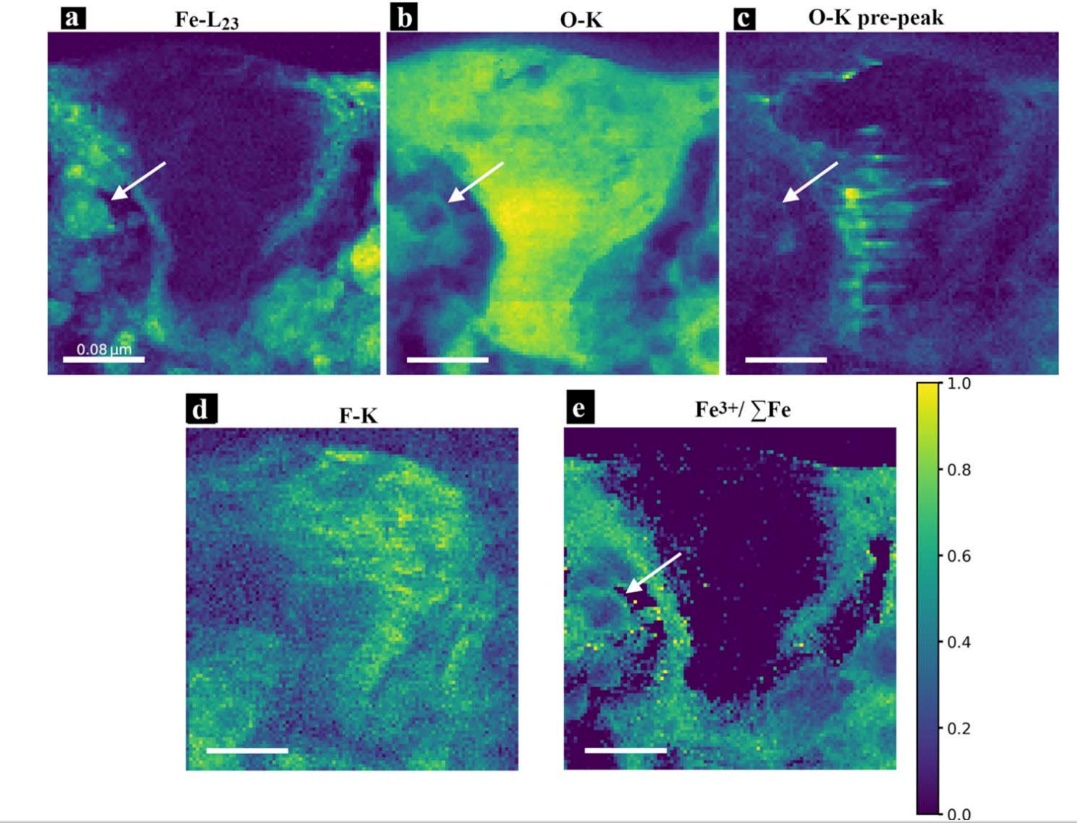
Determination of the local chemistry of meteorites by monochromated EELS: Chemical maps derived from the EELS analysis for the grain Isheyevo_9 and corresponding to (a) Fe, (b) O, (c) the O–K pre-peak, (d) F and (e) the Fe3 +/ΣFe ratio. The white scale bar represents 0.08 μm. The white arrows highlight the presence of GEMS-like materials.
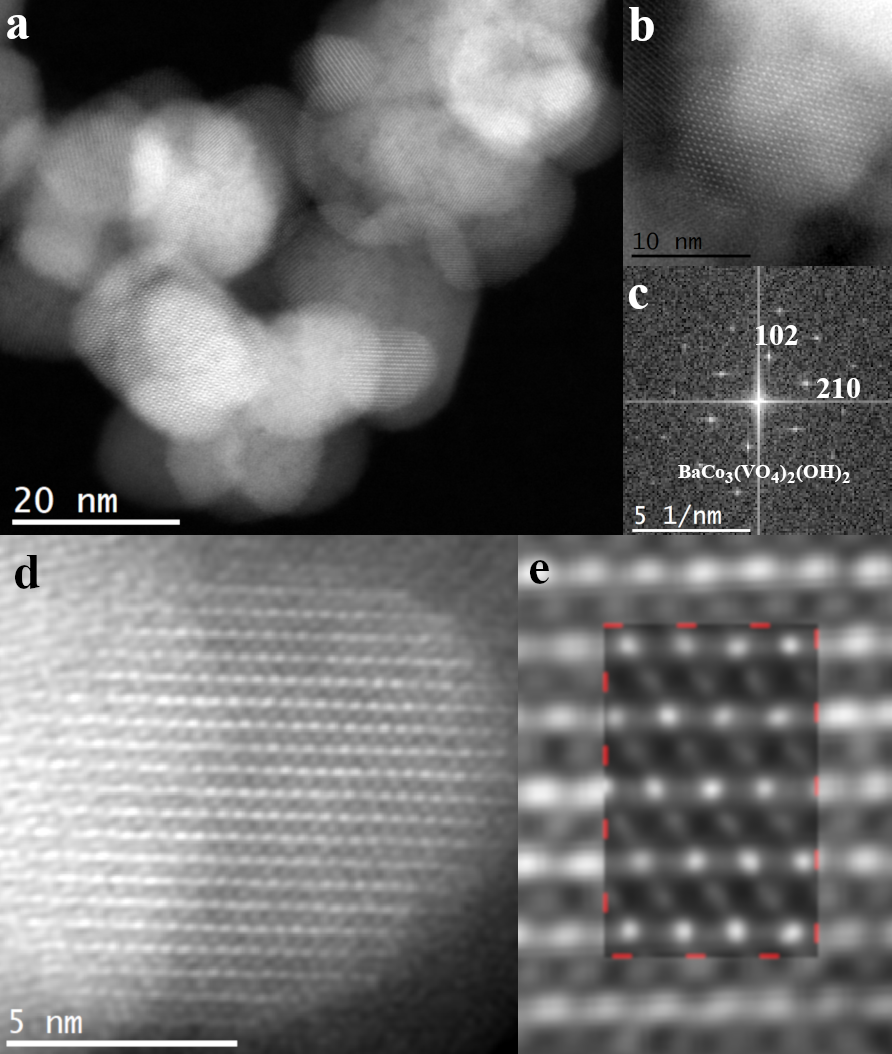
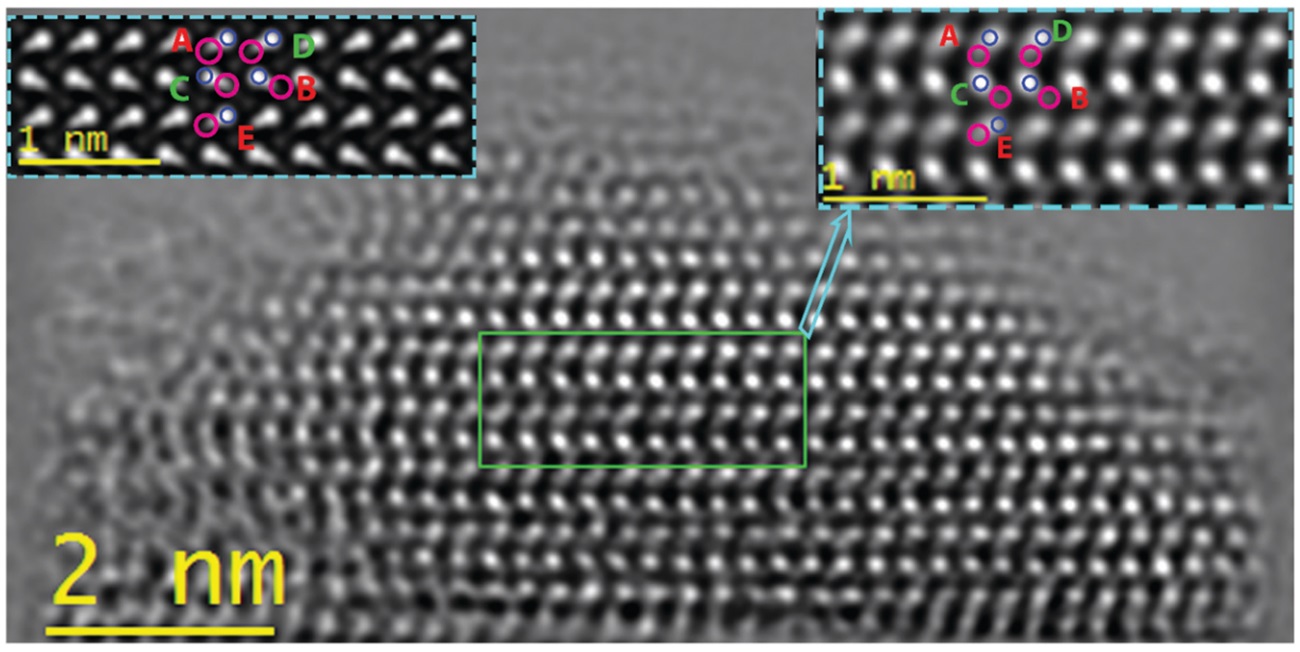
Structure of magnetic nanoparticles: (a) and (b) HR-STEM HAADF micrographs of BaCo3(VO4)2(OH)2 NPs. (c) FFT pattern acquired on the nanoparticle shown in (b). It has been successfully indexed with the XRD-refined BaCo3(VO4)2(OH)2 structure seen along the [241] zone axis. (d) HR-STEM HAADF micrograph of a nanoparticle along the [-141] zone axis. (e) Superposition of the experimental and simulated HR-STEM HAADF images. The experimental image is an enlargement of the nanoparticle shown in (d). The simulated image is delimited by a red dashed line.
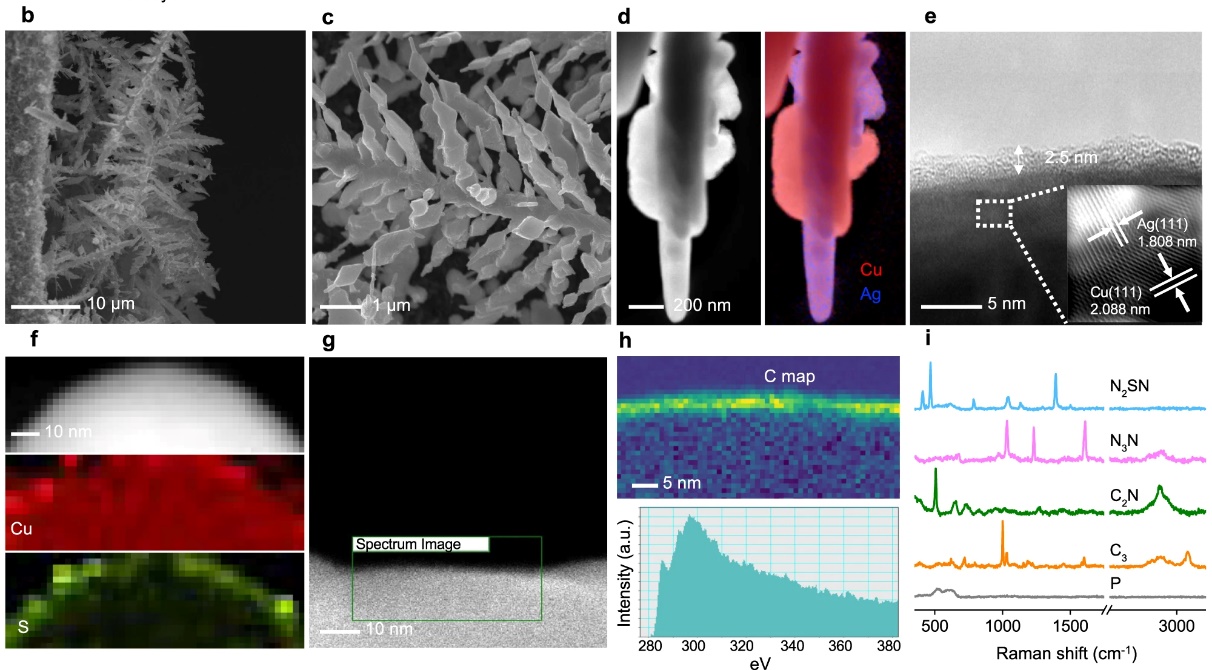
Structure and surface chemistry of electrodes for CO2 conversion to multicarbon products: b, c Cross-section (b) and top-view (c) scanning electron microscope (SEM) images of the functionalized hierarchical Ag–Cu catalyst on a gas diffusion electrode (GDE). d High-angle annular dark-field scanning transmission electron microscopy (HAADF-STEM) image (left) and corresponding Cu (red) and Ag (blue) EDS elemental maps of N2SN-functionalized Ag–Cu (right). e High-resolution transmission electron microscope (HR-TEM) micrograph of the N2SN-functionalized electrode (e). f HAADF-STEM image and the corresponding Cu and S EDS elemental maps taken from a section of Cu surface on the N2SN-functionalized Ag–Cu electrode. g HAADF-STEM image of the Cu surface of N2SN-functionalized Ag–Cu. h (top), Electron energy-loss spectroscopy (EELS) elemental mapping of C taken from the area marked by the box in g. h (bottom), EELS spectrum of the C-K edge with fine structures characteristics of carbon linked to heteroatoms from N2SN layer on the Cu surface. i Raman spectra of pristine (non-functionalized) Ag–Cu (gray), C3-functionalized Ag–Cu (orange), C2N-functionalized Ag–Cu (green), N3N-functionalized Ag–Cu (purple) and N2SN-functionalized Ag–Cu (blue)
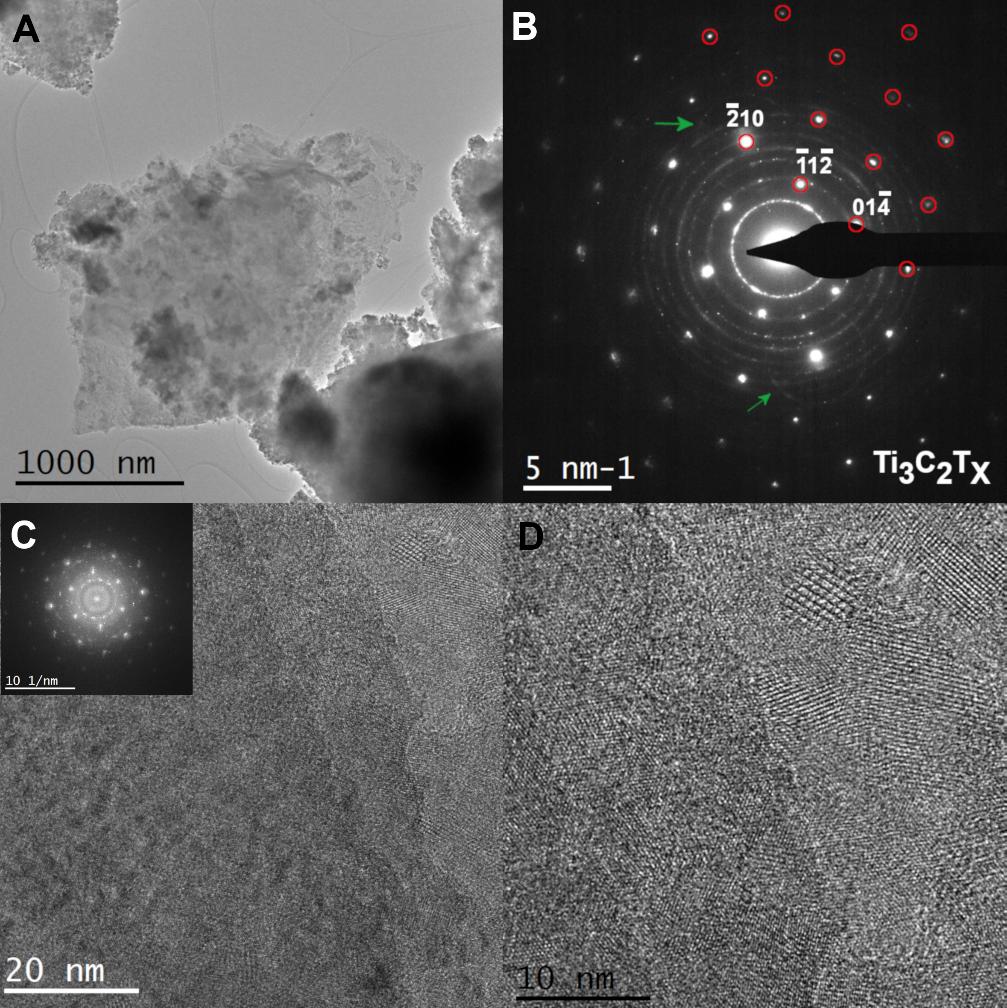
Structure of MXene-based photocatalysts for the removal of benzene: A) SAED acquired on a Mxene sheet. The red circles highlight the automatic indexation with the Ti3C2Tx P63mc structure seen along the [2,4,1] zone axis. The green arrow highlights the rings resulting from double diffraction (B). HR-TEM micrograph shows the surface of a MXene sheet. The inset shows the FFT obtained from the whole micrograph (C). HR-TEM micrograph of the MXene sheet (D).
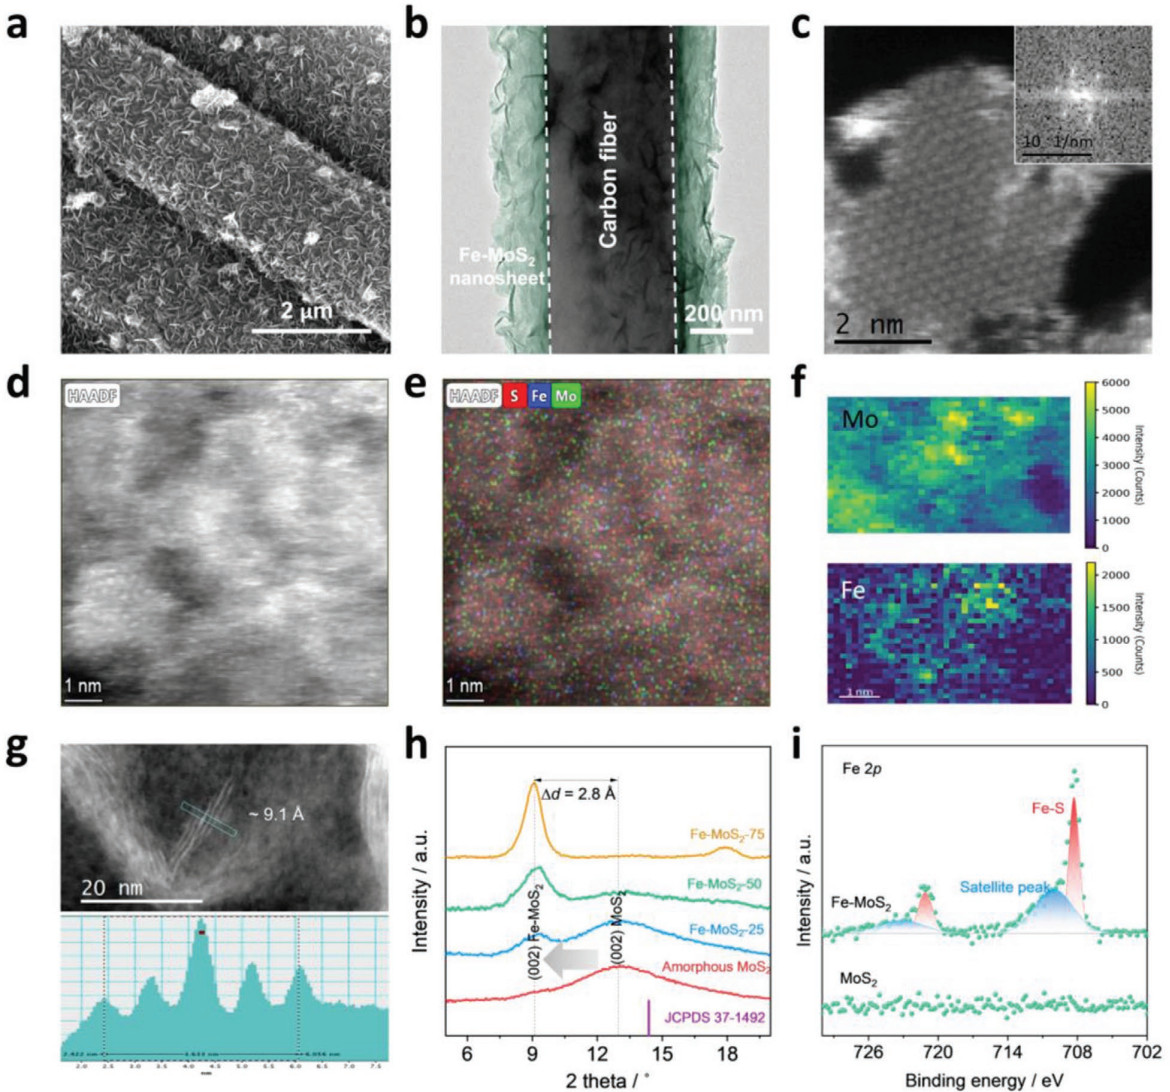
Structure and local chemistry of 2D material-based electrodes for the conversion of nitrate to ammonia: a,b) SEM and TEM images of Fe-MoS2 nanosheets grown on a carbon support. c,d) HAADF-STEM image of Fe-MoS2 nanosheets. Inset: corresponding diffraction pattern confirming the single-crystalline nature of the nanosheet. e,f) High-resolution TEM (HRTEM) – energy dispersive X-ray analyses (EDX) and electron energy loss (EELS) elemental mapping images of Fe-MoS2 nanosheets. g) HR-STEM image of the interlayer spacing of Fe-MoS2 and the corresponding line profiles showing an average d-spacing of ≈ 9.1 Å. h) XRD patterns of the Fe-MoS2 nanosheets with different iron content and compared to pristine MoS2. i) High resolution Fe2p XPS spectra for Fe-MoS2 and MoS2. j) Normalized XANES spectra
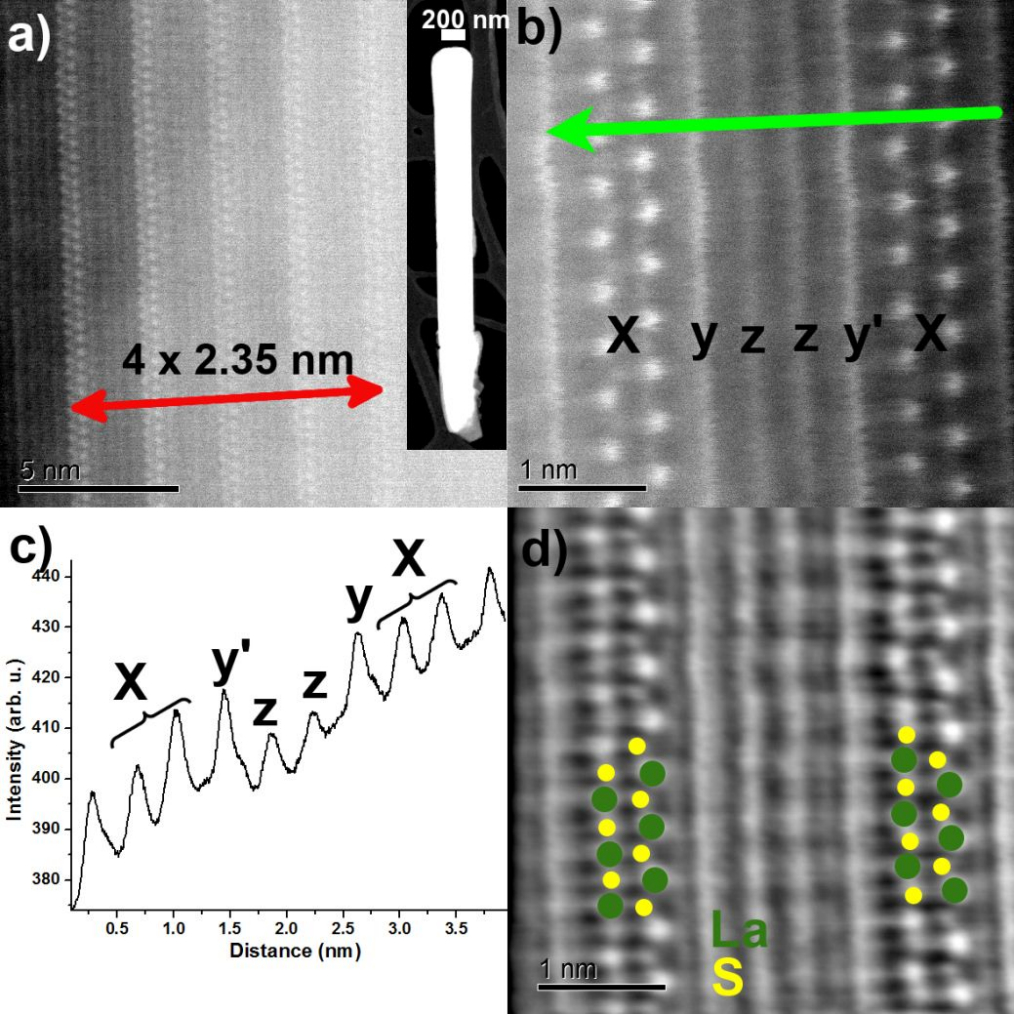
Nanoscale studies of LaS-NbxTa(1–x)S2 nanotubes: a) HRSTEM-ADF micrograph of the surface of the NT shown in the inset. b) HRSTEM-HAADF micrograph taken on the other side of the NT. The green arrow highlights the area used to extract the c) image intensity profile. d) iDPC image acquired simultaneously with the HAADF image shown in b) and superposed with the atomic model of the LaS sub-system.
Negative Cs HR-TEM imaging, NCSI). Determination of InN Quantum dots polarity using Exit Wave Reconstruction techniques.
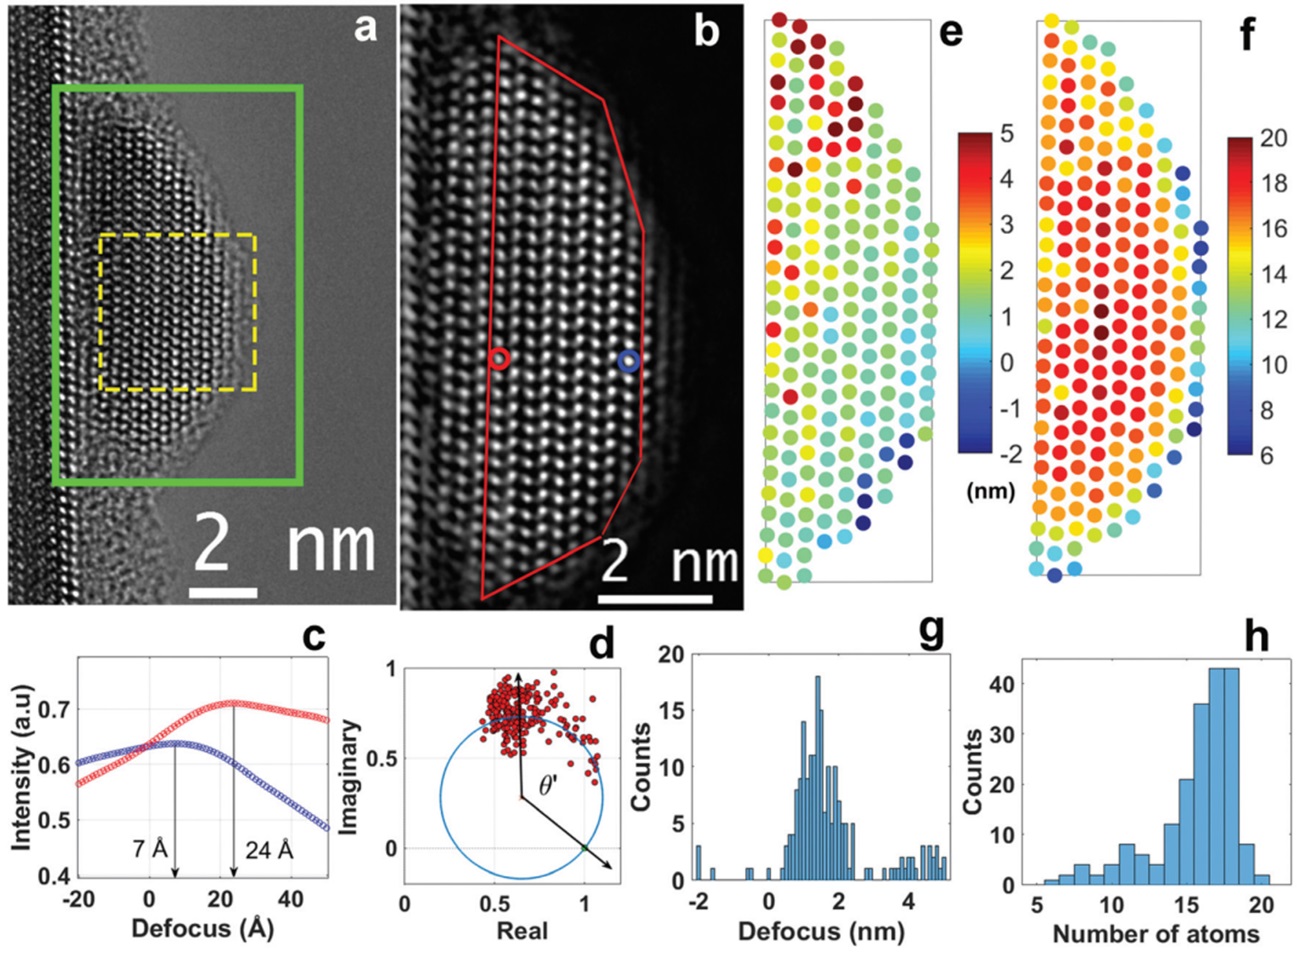
Atomic resolution Tomography of InN quantum dots using on-axis holography. (a) High-resolution lattice image from a set of focal series images. (b) Phase of the reconstructed exit wave of the green rectangular region in (a); the region marked in red is used for tomographic reconstruction. (c) Propagated intensity profile as a function of defocus; the blue and red curves represent the intensity profiles of the atomic column from the edge (blue circle) and centre (red circle) respectively shown in (b). (d) Mass circle and phase of θ’ in the Argand plane. (e) and (f) Focus and mass thickness map of QD respectively. (g) and (h) Histograms of the focus and mass thickness values of the QD respectively.
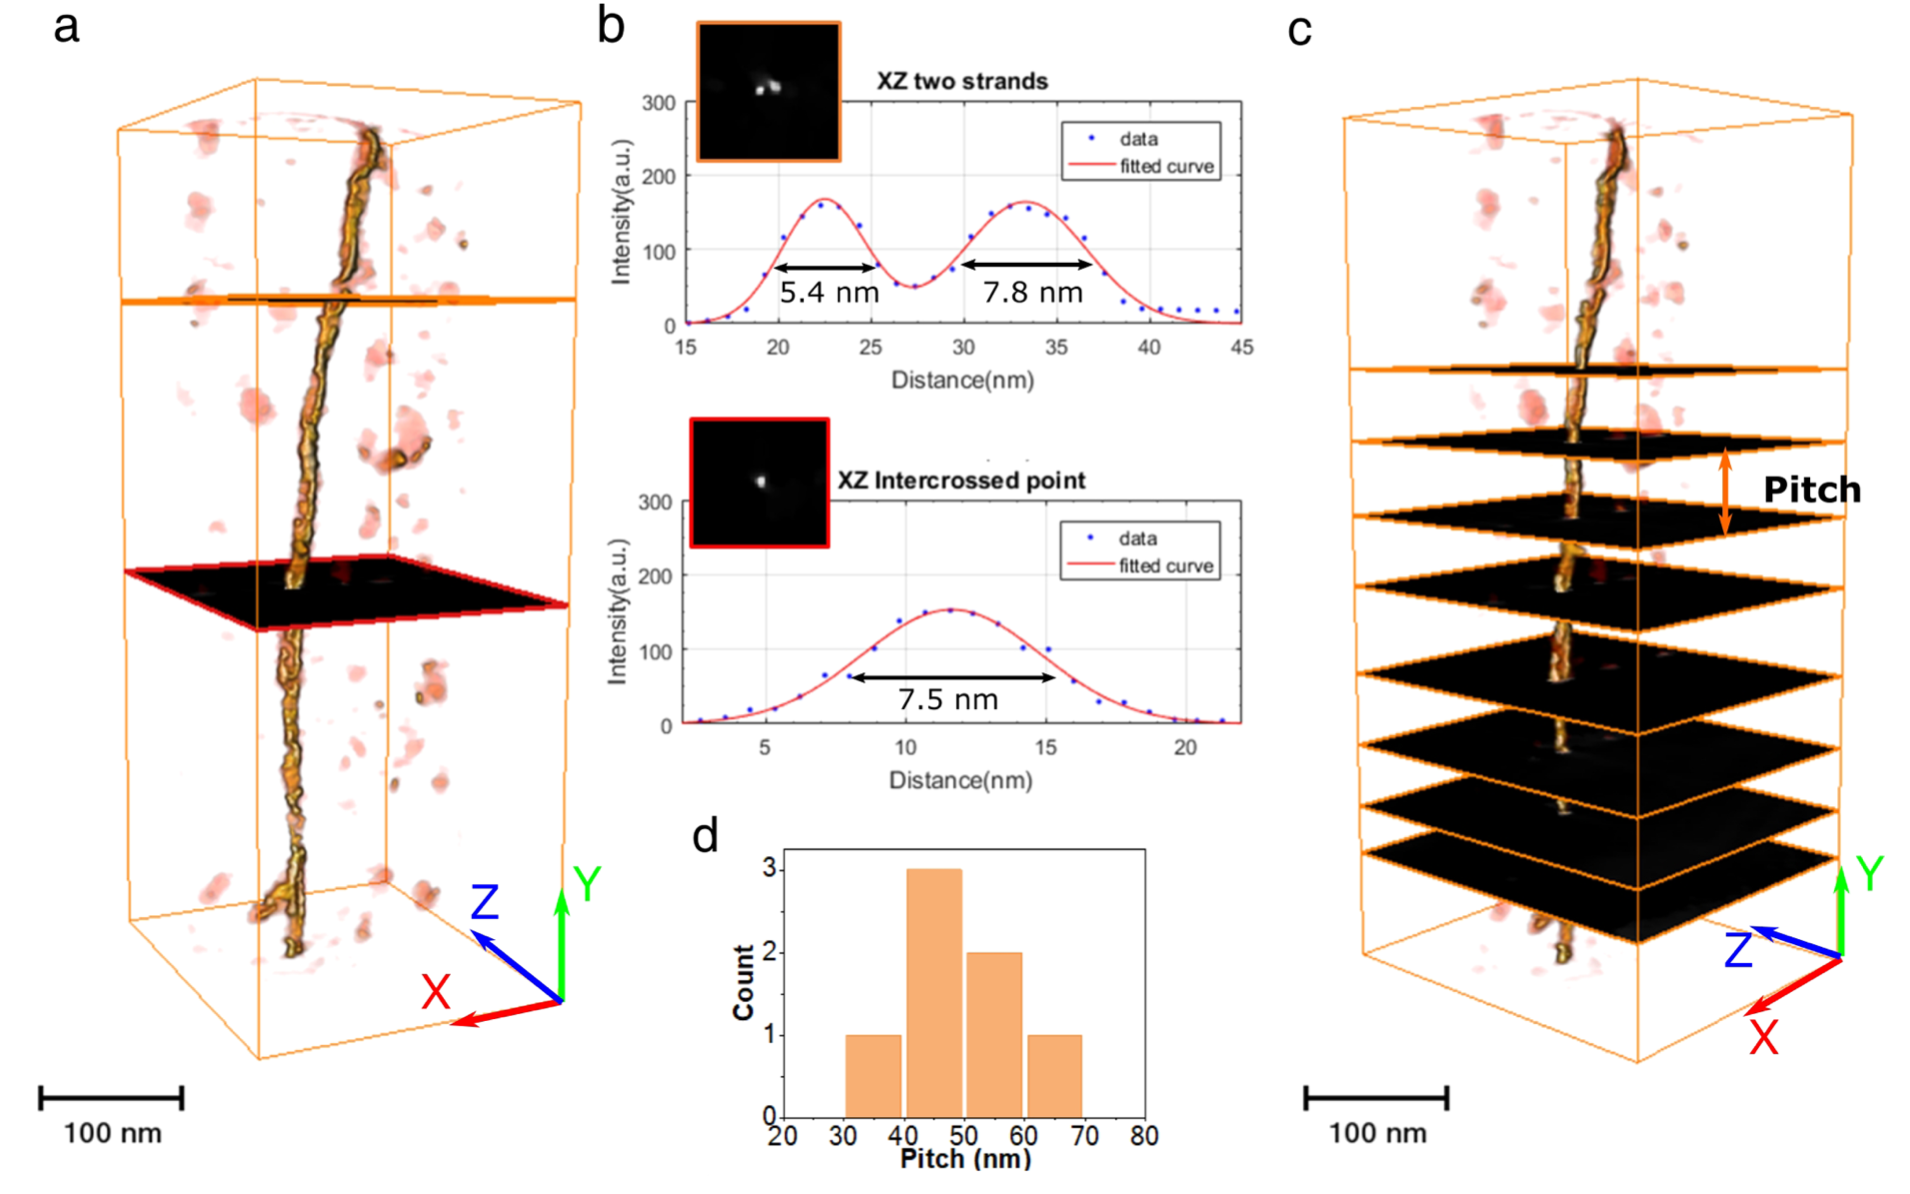
STEM-HAADF Electron Tomography on biomaterials. 3D reconstruction of Apoferritin fibrils. (a) rendering of the volume reconstructed from the tilt series of an APO fibril; (b) cross-sections showing the presence of two intercrossing strands; (c) position of the intercrossing points along the fibril; (d) distribution of the pitch value between intercrossing points.
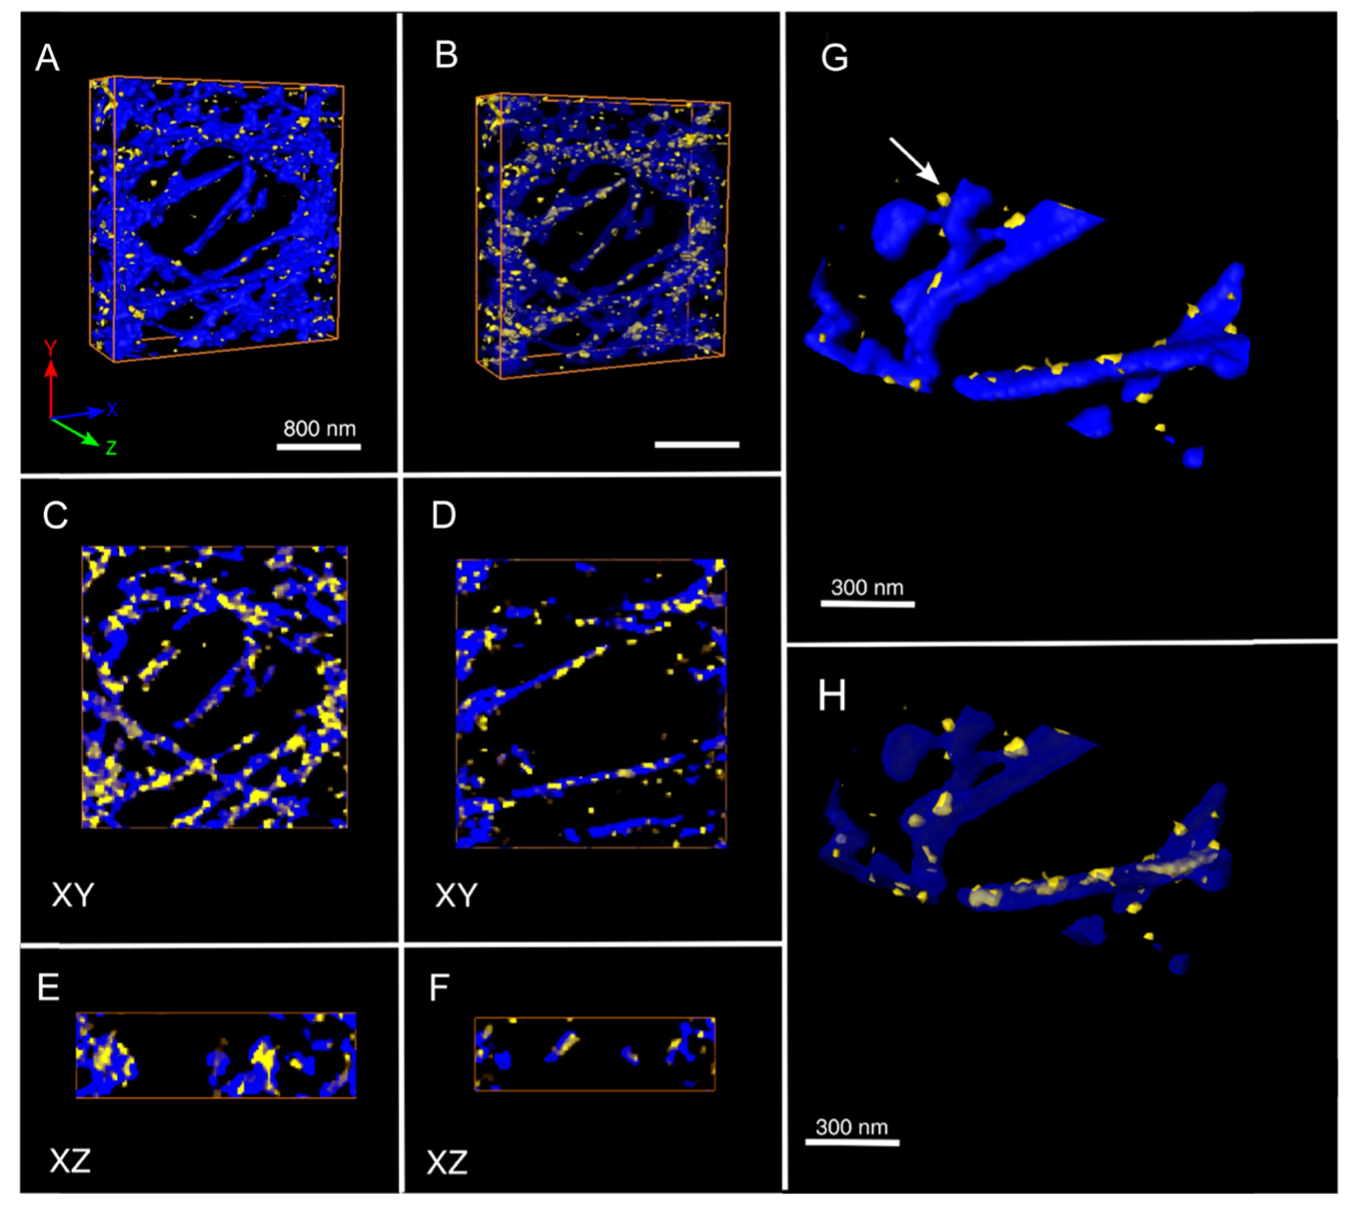
STEM-XEDS Analytical Electron Tomography. In-situ encapsulation of bioactive agrochemicals into fully organic nanotubes. (a,b) 3D perspective views of the spatial distribution of nanotubes (blue) and agrochemical compound (yellow); (c-f) cross-sections showing the distribution of the agrochemical both inside and on the surface of the nanotubes; (g,h) Zoom on the 3D reconstruction both in solid and transparent colors.